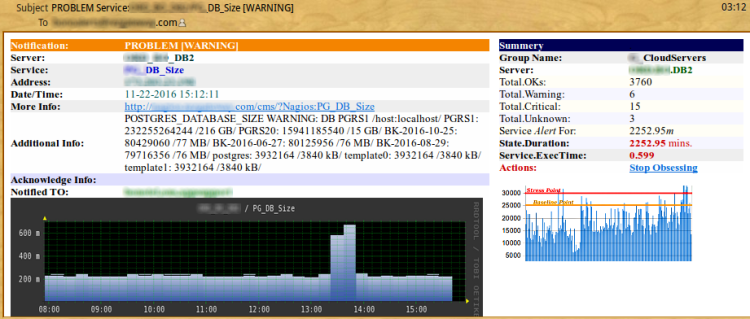
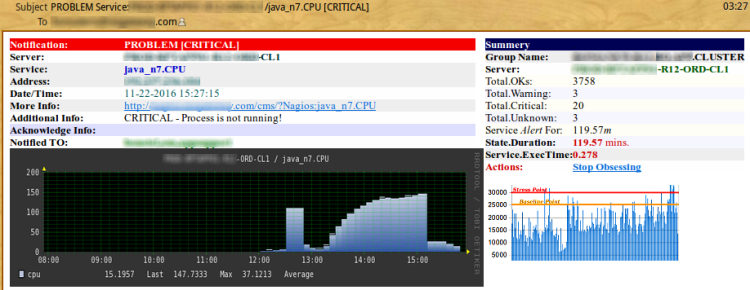
This article describes the plugin that send Nagios HTML Alert Emails with Performance Graphs.
This is the Version 3 of the popular ‘Send HTML Alert Email’. Nagios Alert eMails now contain formatted Text & Performance Graphs which is much smaller saving you bandwidth. Tested with Nagios v3 & 4. This may not work with Nagios v1 (As it requires the use of MACROS)…
Contains Useful Features:
- Performance Graphs
- Total Downtime of the Service upon Recovery
- 4 Colour Coordinated Alerts
- Group & Email Information.
- Low bandwidth usage when downloading hundreds/thousands of Alerts Emails.
- Takes less than 10 minutes to setup.
Requires less than 10 minutes to fully setup.
- Download the three .php files from the github repository, to the nagios/libexec/ folder and give them execution permission..
$> chmod 665 /usr/local/nagios/libexec/ - Open the three php files and check if the 1st line path/to/php and .ini files are correct
- In the three .php files, change the $from email variable to a real name(Else your Email Server might Reject it / or SPAM it).
- In the three .php files, change the $f_domain to your nagios webserver domain name.
- In the “graph_auth.php“, change the $login and $password to your nagios username & password.
- Create a new folder “/usr/local/nagios/cms” and move the “graph_auth.php” and “a_11.png” file to the “/usr/local/nagios/cms/“
[Note: Do not put the graph_auth.php or a_11.png in the /usr/local/nagios/share/ as this folder requires the username/passwd when viewing]
Now edit the “nagios/etc/objects/command.cfg” and replace the [notify-service-by-email] block with the following block.
define command{
  command_name notify-service-by-email
  command_line /usr/local/nagios/libexec/nagios_service_mail.php "$NOTIFICATIONTYPE$" "$HOSTNAME$" "$HOSTALIAS$" "$HOSTSTATE$" "$HOSTADDRESS$" "$SERVICEOUTPUT$" "$SHORTDATETIME$" "$SERVICEDESC$" "$SERVICESTATE$" "$CONTACTEMAIL$" "$SERVICEDURATIONSEC$" "$SERVICEEXECUTIONTIME$" "$TOTALSERVICESWARNING$" "$TOTALSERVICESCRITICAL$" "$TOTALSERVICESUNKNOWN$" "$NOTIFICATIONRECIPIENTS$" "$TOTALSERVICESOK$" "$SERVICENOTIFICATIONNUMBER$" "$SERVICEACKCOMMENT$" "$HOSTGROUPNAME$" "$SERVICEPERFDATA$"
}
Also replace the [notify-host-by-email] code block with the following block.
define command{
  command_name notify-host-by-email
  command_line /usr/local/nagios/libexec/nagios_host_mail.php "$NOTIFICATIONTYPE$" "$HOSTNAME$" "$HOSTALIAS$" "$HOSTSTATE$" "$HOSTADDRESS$" "$HOSTOUTPUT$" "$SHORTDATETIME$" "$SERVICEDESC$" "$SERVICESTATE$" "$CONTACTEMAIL$" "$TOTALHOSTSUP$" "$TOTALHOSTSDOWN$" "$HOSTGROUPNAME$" "$SERVICEPERFDATA$"
}
Check your nagios/libexec folder paths are accurate and save the “command.cfg” file.
In order to get the graph to render, we need to configure the Apache “httpd.conf” file. Go ahead and open the “/etc/httpd/conf/httpd.conf” and add an extra VirtualHost as follows.. (The ServerName & ServerAlias should be your nagios domain name)
<VirtualHost *:80>
  ServerAdmin operations@mycompany.com
  ServerName nagios.mycompany.com
  ServerAlias nagios.mycompany.com
  DocumentRoot "/usr/local/nagios/cms"
  ErrorLog logs/nagios-error_log
</VirtualHost>
The emails are sent using the PHP mail() function. A set of temporary files are written to the root level /tmp folder in order to determine the Total Downtime upon Service Recovery. Many MACROS are used in order to boost the Usable Data, hence I am not sure if it will work on Older Nagios v2.0.
————————————————————————–
[Optional Bonus]:
If you have CMSimple “Content Management” installed, you can create a custom link which Network Staff can click and get the details of every single Service Type and Description. In order to do this, you will need to install the CMSimple and create headings with Identical Names as the Service Name in Nagios. The dummy domain nagios.cmsnagios.com was used as the Nagios WebSite. The CMSimple was used to compliment the New Network Staff.
For example: In Nagios/ Server Win32 DOG7 has a service name cpu_load (which describes the CPU), create a CMS heading cpu_load and write a detailed description about it.
You may email me for further descriptions on CMS Manipulations.
Let me know if you have any queries regarding the Email plugins.. Would love to hear from you..

not showing the graph in alert email
Posted by Satish Singh | December 7, 2017, 5:31 pmWere you able to resolve this? — I have some tips in the nagios exchange site (https://exchange.nagios.org/directory/Addons/Notifications/Send-HTML-Alert-Email-v3/details)
Posted by Shawn Brito | November 17, 2020, 4:14 pmGraph_auth.php seems not working properly, getting blank page with no error, did I missing something here ?
Posted by Dan | November 17, 2020, 5:09 amThe graph_auth.php connects directly to the pnp4nagios URL. In order to get this working, you will need to provide the username/passwd and url domain of the pnp4nagios correctly (edit the graph_auth.php and see how the $f_domain variable appends with the /pnp4nagios/ folder)
After which you can directly call the graph_auth.php from the browser using the following URL.
http://your-domain/graph_auth.php?host=serverName&srv=serviceName
As shown above provide the host & service (srv) names. Test it out, as this is the url that’s getting called from the emails directly.
Posted by Shawn Brito | November 17, 2020, 8:12 amThank you for your replied.
Yes, I have corrected auth credential in graph_auth.php.
All variable seems setting correctly. I can brown direct from pnp4nagios but not without URL link. It gets blank page with no error.
Here are screenshots:
https://www.dtechsolutionllc.com/dnld/tmp/email-notification-1.png <= graph_auth.php
https://www.dtechsolutionllc.com/dnld/tmp/email-notification-2.png <= Blank page
https://www.dtechsolutionllc.com/dnld/tmp/email-notification-3.png <= Direct browse from pnp4nagios
Thanks for your help !
Dan
Posted by Dan | November 17, 2020, 1:39 pmThank you for your replied.
Yes, username/password are set correctly and all variable seems OK.
Please see below screenshots
https://www.dtechsolutionllc.com/dnld/tmp/email-notification-1.png <= graph_auth.php
https://www.dtechsolutionllc.com/dnld/tmp/email-notification-2.png <= blank page with no error message
https://www.dtechsolutionllc.com/dnld/tmp/email-notification-3.png <= direct browse from pnp4nagios
Thanks for your help !
Posted by Dan | November 17, 2020, 1:48 pmHi Dan,
Looking at the URL, I noticed your accessing the link by using the save server name for the service name..7
graph_auth.php?host=c1841&srv=c1841
The host name appears to be right, but the srv should be the service name, (not the server name).. For example, on my servers, I have services names like: (cpu_load, free_mem, disk_space, etc)
Posted by Shawn Brito | November 17, 2020, 4:11 pmHi Shaw,
That is I direct access from pnp4nagios not from graph_auth.php. and it worked as expected

However, graph_auth.php calling is not working and get blank page as you can see from screenshot below

BTW. I am using CentOS 7 with PHP version 7.3.2 and curl package is installed as well. Any idea what could be wrong from my end ?
Thanks,
Dan
Posted by Dan | November 17, 2020, 4:29 pmWere you able to check the Apache error & access log files for the error message? This might give you some hints in finding the actual issue..
Posted by Shawn Brito | November 17, 2020, 4:51 pmNo error log indicated the this issue, suspected it could be your php call may not working with newer php7 or above, but I could be wrong…
Posted by Dan | November 17, 2020, 6:49 pm